Skip to content

Chapter 10

Sampling and reconstruction

Five lessons in Part IV, From analog to digital. Read them in order, or start anywhere: a prerequisite is a link, never a gate.

Start with 10.1
0 of 5 read4 on the essential pathabout 93 minutes

Lessons in this chapter

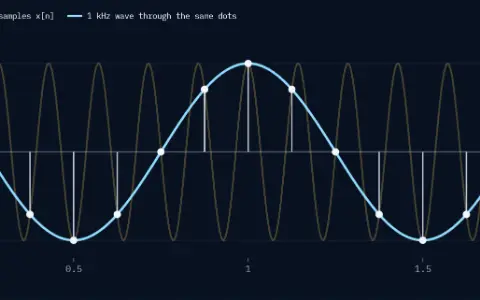
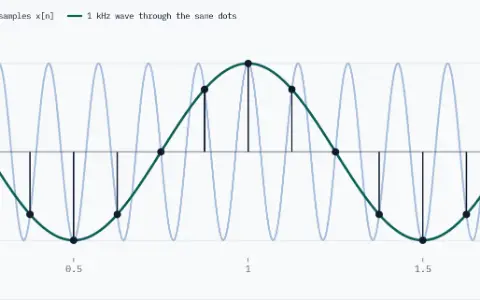
A 7 kHz cosine over 2 milliseconds, faded. 17 samples taken at 8 kHz, one every 0.125 milliseconds. A 1 kHz cosine passes through every sample.A 7 kHz cosine over 2 milliseconds, faded. 17 samples taken at 8 kHz, one every 0.125 milliseconds. A 1 kHz cosine passes through every sample.

Lesson 1 Essential15 minYou are hereRead

Sampling & aliasing

Predict where a tone lands once only its samples are kept, see why a fast tone becomes a slow one, and why a square wave does it at any note.

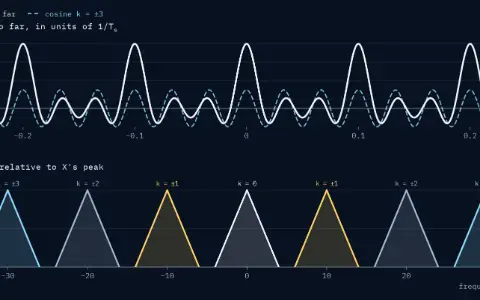
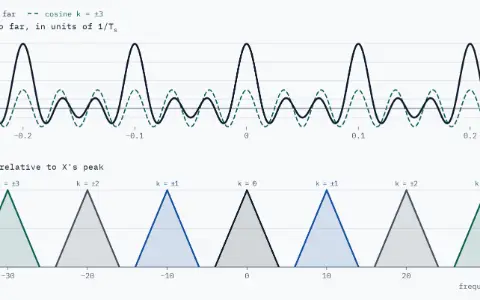
Comb panel: the comb so far, 3 cosines added, peaks of 7 at 0, ±0.1 and ±0.2 ms. Spectrum panel: copies of X centred at 0, ±10, ±20 and ±30 kHz. Sample rate f_s = 10 kHz.Comb panel: the comb so far, 3 cosines added, peaks of 7 at 0, ±0.1 and ±0.2 ms. Spectrum panel: copies of X centred at 0, ±10, ±20 and ±30 kHz. Sample rate f_s = 10 kHz.

Lesson 2 Essential25 minYou are hereRead

The sampling theorem

Sampling copies a signal's spectrum to every multiple of the sample rate. See why the copies stay apart exactly when the rate exceeds twice the highest frequency.

Seventeen samples x[n] of a smooth wave, 1 ms apart, from −8 to 8 ms, with the wave they came from dashed. 17 pulses added. Largest gap between the sum and the wave from −2 to 2 ms: 0.016.Seventeen samples x[n] of a smooth wave, 1 ms apart, from −8 to 8 ms, with the wave they came from dashed. 17 pulses added. Largest gap between the sum and the wave from −2 to 2 ms: 0.016.

Lesson 3 Essential18 minYou are hereRead

Reconstruction

Put a pulse at every sample and add. See why only the sinc pulse rebuilds the original, and what a hold or straight lines cost.

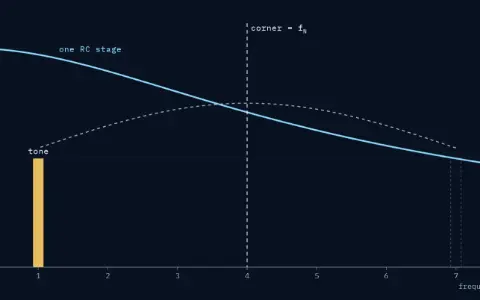
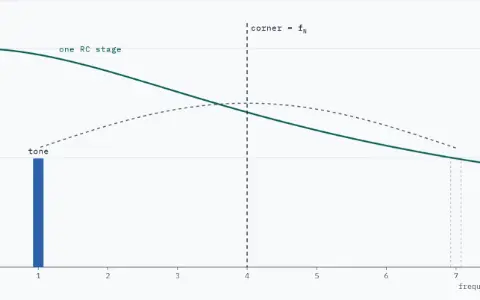
Gain of one RC stage against frequency from 0 to 8 kHz, with its corner at 4 kHz, which is f_N. The tone bar has size 0.496 and stands at 1 kHz. After sampling at 8 kHz it lands on 1 kHz.Gain of one RC stage against frequency from 0 to 8 kHz, with its corner at 4 kHz, which is f_N. The tone bar has size 0.496 and stands at 1 kHz. After sampling at 8 kHz it lands on 1 kHz.

Lesson 4 Essential20 minYou are hereRead

Anti-aliasing and practical converters

See why a filter corner at the Nyquist frequency fails, count the filter order a 60 dB spec needs, and estimate the jitter limit on SNR.

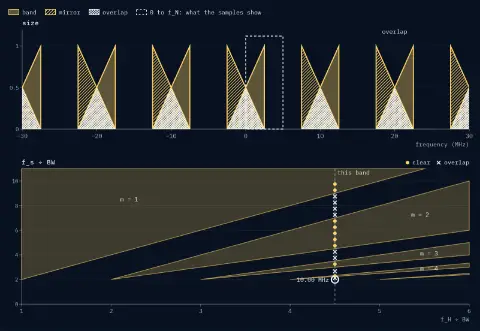
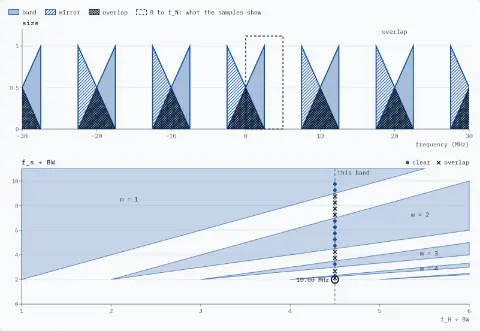
Spectrum, −30 to 30 MHz, sampled at 10.00 MHz: copies of the band and its mirror overlap, for example from 27.50 to 30.00 MHz; the stretch 0 to 5.00 MHz is what the samples show. Chart of f_s ÷ BW against f_H ÷ BW, on the line at 4.5 for this band, the rates tried so far: clear from 50.00 to 45.00 MHz, overlapping from 45.00 to 35.00 MHz, clear from 35.00 to 22.50 MHz, overlapping from 22.50 to 17.50 MHz, clear from 17.50 to 15.00 MHz, overlapping from 15.00 to 11.67 MHz, clear from 11.67 to 11.25 MHz, overlapping from 11.25 to 10.00 MHz. The allowed wedges m = 1 to m = 4 are shown.Spectrum, −30 to 30 MHz, sampled at 10.00 MHz: copies of the band and its mirror overlap, for example from 27.50 to 30.00 MHz; the stretch 0 to 5.00 MHz is what the samples show. Chart of f_s ÷ BW against f_H ÷ BW, on the line at 4.5 for this band, the rates tried so far: clear from 50.00 to 45.00 MHz, overlapping from 45.00 to 35.00 MHz, clear from 35.00 to 22.50 MHz, overlapping from 22.50 to 17.50 MHz, clear from 17.50 to 15.00 MHz, overlapping from 15.00 to 11.67 MHz, clear from 11.67 to 11.25 MHz, overlapping from 11.25 to 10.00 MHz. The allowed wedges m = 1 to m = 4 are shown.

Lesson 515 minYou are hereRead

Bandpass sampling

Sample a high band far below twice its top edge, list the allowed rate islands, and pick a safe rate in the middle of one.

After this chapter

Where to go next.

The chapters either side, and the rest of Part IV in the library.

Phasorium
LibraryEvery lesson, in order

Parts

About Phasorium
Look