Skip to content

Chapter 32

Measurement and sensing

Two lessons in Part XI, Applications. Read them in order, or start anywhere: a prerequisite is a link, never a gate.

Start with 32.1
0 of 2 readabout 40 minutes

Lessons in this chapter

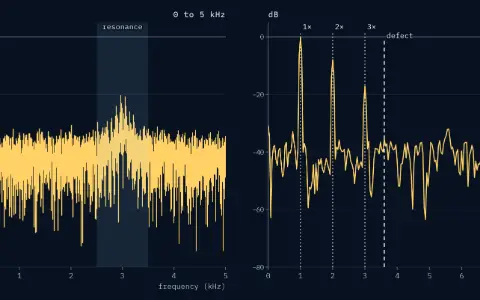
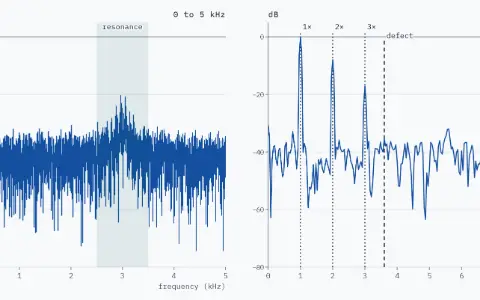
Two panels of the amplitude spectrum in dB re 1, from −80 to 5 dB, lower levels drawn on the floor. The panel 0 to 5 kHz: frequency in kilohertz. The panel orders: order from 0 to 8, that is 0 to 200 Hz. 0 to 5 kHz: a solid spectrum with three tall lines at 25, 50 and 75 Hz, a floor near −41.7 dB, and a hump from 2.5 to 3.5 kHz. The resonance band, 2.5 to 3.5 kHz, is shaded and labelled resonance; its median is −37.9 dB. Orders: lines at orders 1, 2 and 3, marked by dotted verticals labelled 1×, 2× and 3×, at 0.0 dB, −8.0 dB and −17.1 dB; between them the floor. A dashed vertical labelled defect at order 3.60, 90 Hz, where the spectrum reads −35.5 dB. Between 80 and 200 Hz, 6 noise bins stand taller than it.Two panels of the amplitude spectrum in dB re 1, from −80 to 5 dB, lower levels drawn on the floor. The panel 0 to 5 kHz: frequency in kilohertz. The panel orders: order from 0 to 8, that is 0 to 200 Hz. 0 to 5 kHz: a solid spectrum with three tall lines at 25, 50 and 75 Hz, a floor near −41.7 dB, and a hump from 2.5 to 3.5 kHz. The resonance band, 2.5 to 3.5 kHz, is shaded and labelled resonance; its median is −37.9 dB. Orders: lines at orders 1, 2 and 3, marked by dotted verticals labelled 1×, 2× and 3×, at 0.0 dB, −8.0 dB and −17.1 dB; between them the floor. A dashed vertical labelled defect at order 3.60, 90 Hz, where the spectrum reads −35.5 dB. Between 80 and 200 Hz, 6 noise bins stand taller than it.

Lesson 120 minYou are hereRead

Vibration and machine monitoring

Read a machine's vibration spectrum in orders of its shaft speed, then find a hidden bearing crack by band-passing, taking the envelope and its spectrum.

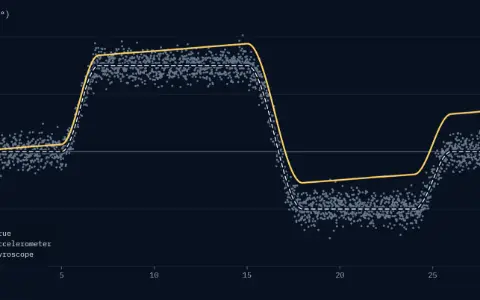
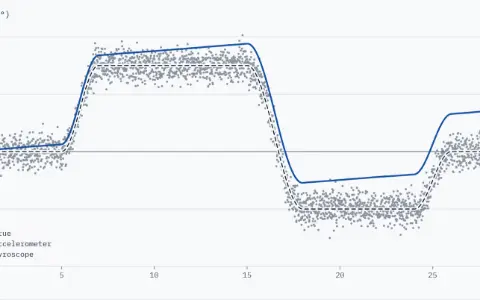
One panel, time from 0 to 30 s across and tilt from −40 to 45° up. The true tilt is a dashed line (true): level, up to 30° over 5 to 7 s, down to −20° over 15 to 18 s, back to 0 over 24 to 26 s. Drawn to 30 s: the accelerometer's readings, small dots (accelerometer), scatter about the truth, error 3.00° RMS since 5 s. The gyroscope's added-up angle, a solid line (gyroscope), follows the turns and is 15.2° off now.One panel, time from 0 to 30 s across and tilt from −40 to 45° up. The true tilt is a dashed line (true): level, up to 30° over 5 to 7 s, down to −20° over 15 to 18 s, back to 0 over 24 to 26 s. Drawn to 30 s: the accelerometer's readings, small dots (accelerometer), scatter about the truth, error 3.00° RMS since 5 s. The gyroscope's added-up angle, a solid line (gyroscope), follows the turns and is 15.2° off now.

Lesson 220 minYou are hereRead

Sensor signal conditioning

Sensors lie by offset, drift, noise and spikes. Fuse a noisy accelerometer and a drifting gyroscope into a steady tilt with a complementary filter.

After this chapter

Where to go next.

The chapters either side, and the rest of Part XI in the library.

Phasorium
LibraryEvery lesson, in order

Parts

About Phasorium
Look