Skip to content

Chapter 8

The Fourier transform

Four lessons in Part III, Fourier analysis of continuous-time signals. Read them in order, or start anywhere: a prerequisite is a link, never a gate.

Start with 8.1
0 of 4 read4 on the essential pathabout 115 minutes

Lessons in this chapter

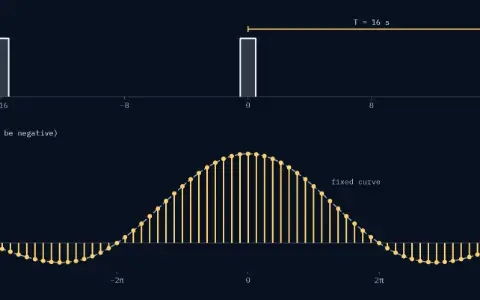
Unit pulses repeated every 16.000 s. Line spectrum from −4π to 4π rad/s: 65 lines, 0.393 rad/s apart, each multiplied by 16.000. Heights at 0.000, 0.393, 0.785, 1.178, 1.571, 1.963 rad/s: 1.000, 0.994, 0.974, 0.943, 0.900, 0.847. Every line stands on the same fixed curve.Unit pulses repeated every 16.000 s. Line spectrum from −4π to 4π rad/s: 65 lines, 0.393 rad/s apart, each multiplied by 16.000. Heights at 0.000, 0.393, 0.785, 1.178, 1.571, 1.963 rad/s: 1.000, 0.994, 0.974, 0.943, 0.900, 0.847. Every line stands on the same fixed curve.

Lesson 1 Essential30 minYou are hereRead

From series to transform

Stretch a pulse train's period until its lines crowd onto one curve, then read that curve, the Fourier transform, by winding, width and band.

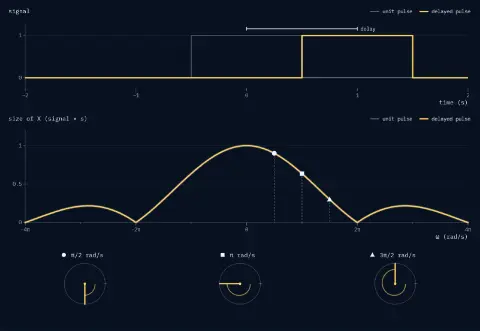
Time panel: the unit pulse delayed by 1 s, over a faint copy of the pulse at its start. Spectrum panel: the size of X against ω in rad/s, 1 at 0 rad/s with its first zeros at ±2π; it does not move and sits exactly on its faint copy. Dials: at π/2 rad/s turned by −90°, at π rad/s turned by −180°, at 3π/2 rad/s turned by −270°.Time panel: the unit pulse delayed by 1 s, over a faint copy of the pulse at its start. Spectrum panel: the size of X against ω in rad/s, 1 at 0 rad/s with its first zeros at ±2π; it does not move and sits exactly on its faint copy. Dials: at π/2 rad/s turned by −90°, at π rad/s turned by −180°, at 3π/2 rad/s turned by −270°.

Lesson 2 Essential30 minYou are hereRead

Properties of the Fourier transform

Delay, squeeze, multiply, convolve and differentiate a signal, and read each change in its spectrum from one rule per operation.

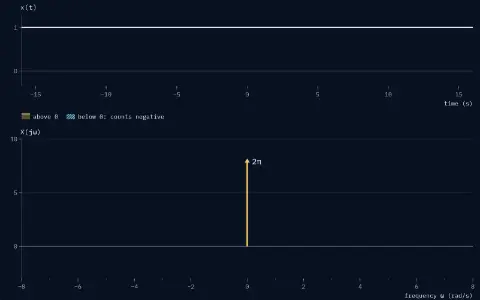
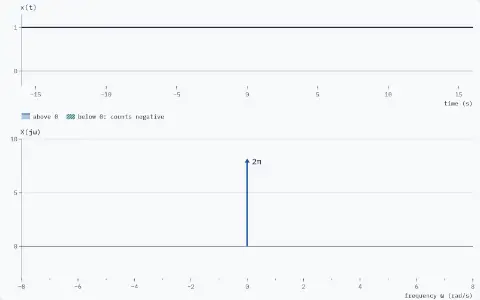
Time: a level of 1 that never ends. Spectrum: one arrow at 0 rad/s labelled 2π; area of the whole curve 6.283.Time: a level of 1 that never ends. Spectrum: one arrow at 0 rad/s labelled 2π; area of the whole curve 6.283.

Lesson 3 Essential25 minYou are hereRead

Transforms of common signals

See why signals that never end have spikes in their spectrum, read a spike by its area, and build the standard transform table.

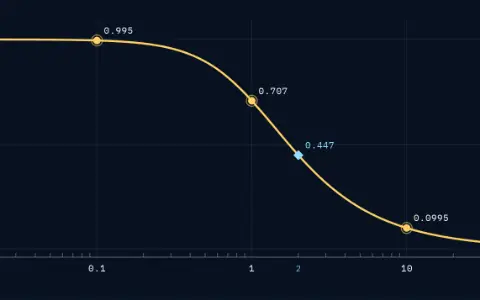
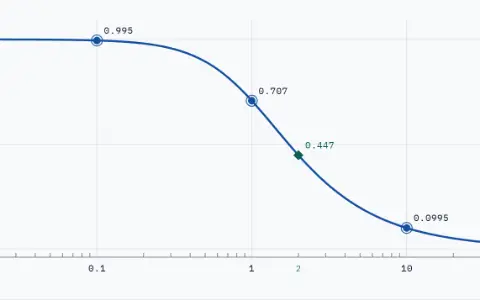
Gain of the RC circuit, RC = 1 s, against frequency on a logarithmic axis from 0.01 to 100 rad/s, with decade gridlines and minor ticks. Dots on the curve: 0.995 at 0.1 rad/s, 0.707 at 1 rad/s, 0.447 at 2 rad/s, 0.0995 at 10 rad/s.Gain of the RC circuit, RC = 1 s, against frequency on a logarithmic axis from 0.01 to 100 rad/s, with decade gridlines and minor ticks. Dots on the curve: 0.995 at 0.1 rad/s, 0.707 at 1 rad/s, 0.447 at 2 rad/s, 0.0995 at 10 rad/s.

Lesson 4 Essential30 minYou are hereRead

Frequency response and Bode plots

Sweep a circuit across every frequency, read its gain and lag on a logarithmic Bode plot, and see why an ideal filter cannot be built.

After this chapter

Where to go next.

The chapters either side, and the rest of Part III in the library.

Phasorium
LibraryEvery lesson, in order

Parts

About Phasorium
Look